In January 2025, Georgia-Russia trade turnover increased by almost 7% to USD 203 million 263 thousand.
According to official statistics, Russia took third place in the ranking of the largest trading partners after the USA and the UK with a share of 10.1%.
The increased trade figure is associated with a growth in imports of goods from Russia. In January, Georgia purchased goods worth USD 169.2 million from Russia, which was 14% more than last year's imports. Thus, Russia took third place in the ranking of importing countries, behind the USA, the UK and Turkey.
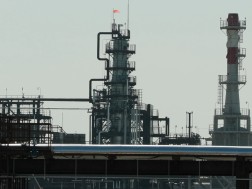
In the first month of 2025, imports of oil and oil products from Russia increased.
The TOP-10 Imported Goods:
1. Oil and petroleum products - $55.3 million, 78,266 tons;
2. Petroleum gases and other gaseous hydrocarbons - $37.9 million, 141,968 tons;
3. Machinery for processing materials by processes involving temperature changes - $8.4 million, 1,682 tons;
4. Carbon steel bars, unprocessed - $5 million, 9,859 tons;
5. Wheat and meslin - $4.7 million, 19,451 tons.
6. Coal, solid fuels - $3.2 million, 27,340 tons;
7. Processed cereal grains - $3 million, 13,590 tons;
8. Hydrocarbons cyclic - $2.8 million, 4,900 tons;
9. Sunflower oil - $2.7 million, 2,115 tons;
10. Live pigs - $2.2 million, 1,626 tons.
In January, exports to Russia decreased by 18.2%, and goods worth USD 34 million left the country in this direction. Russia took fifth place in the ranking of the largest exporting countries with an 8.4% share. The decline in exports to this country during this period was mainly due to a decrease in sales of locally produced alcoholic beverages, lemonades, citrus fruits and ferroalloys.
Top-10 Exported Goods:
1. Natural grape wines - $6.9 million, 2,561 tons;
2. Mineral and fresh waters - $6.7 million, 12,435 tons;
3. Ethyl alcohol - $5.1 million, 1,136 tons;
4. Potatoes - $2.9 million, 7,612 tons;
5. Mineral waters with added sugar - $2.4 million, 3,004 tons;
6. Canned fruits and other plant parts - $2.4 million, 357 tons;
7. Apples, pears, quinces - $1.5 million, 2,499 tons;
8. Mixtures for use in the production of beverages - $1 million, 86 tons;
9. Citrus fruits - $983 thousand, 1,523 tons;
10. Spices - $621 thousand, 118 tons.